Manufacturing in Mexico vs China Key Insights
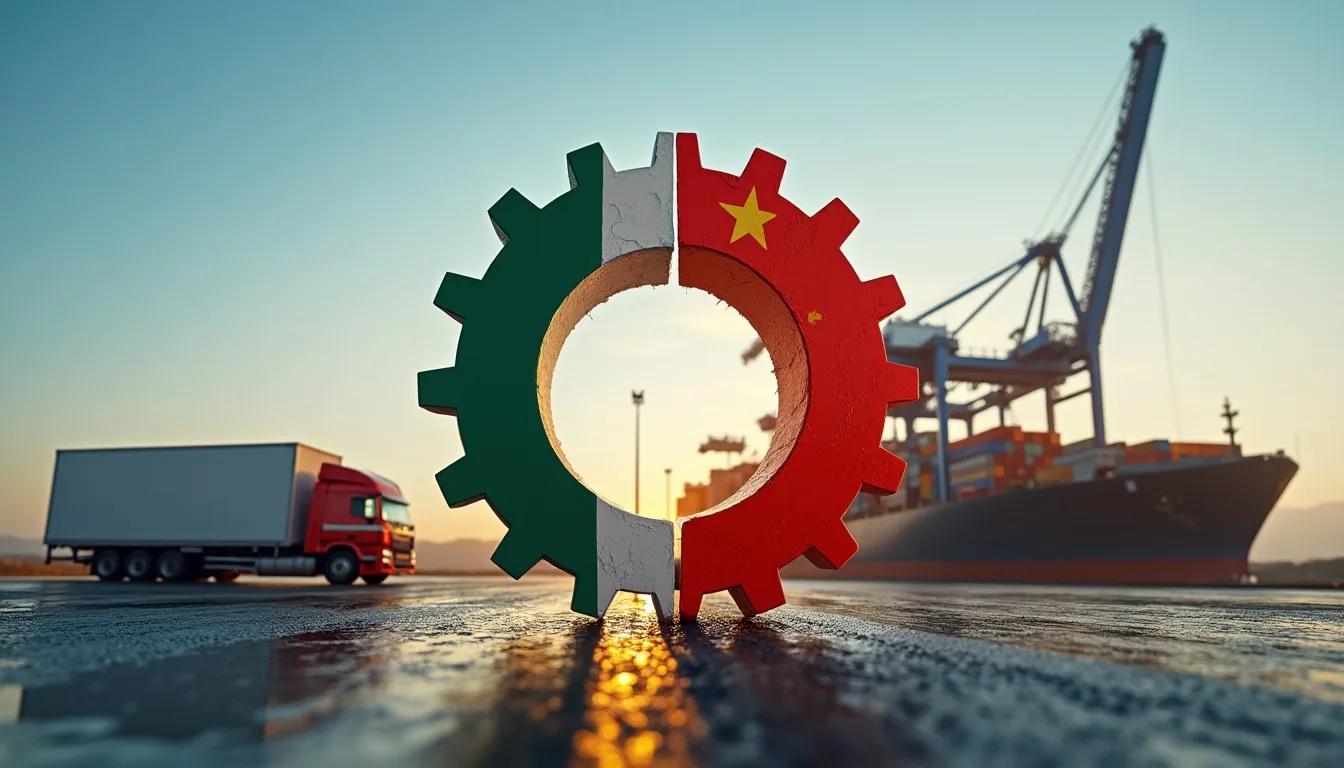
Manufacturing in mexico vs china presents a compelling choice for global businesses, with Mexico gaining ground through nearshoring advantages like proximity to the US market and lower overall costs, while China maintains strengths in scale and established supply chains. This guide compares key aspects including labor rates, logistics, quality standards, workforce skills, and 2025 trends amid Mexico surpassing China as the top US importer in 2023 with USD 475 billion in goods. Backed by recent data showing Mexico’s manufacturing wages 20% lower than China’s when productivity-adjusted, you’ll see how factors like USMCA tariffs and geopolitical shifts influence decisions. Whether evaluating relocation or optimization, understand the nuances driving a 25% FDI surge in Mexico’s sector.
Cost Comparison in Manufacturing in Mexico vs China
When comparing manufacturing in mexico vs china, costs often tip the scale, with Mexico offering burdened labor rates of USD 6-7 per hour in 2025 versus China’s USD 8-10, factoring in benefits and productivity. Mexico’s minimum wage rose 12% to MXN 278.80 daily, but overall expenses remain lower due to reduced shipping and tariffs under USMCA.
China’s scale economies lower unit costs for high-volume runs, but rising wages up 7% annually and trade tensions add premiums. Mexico counters with energy costs 30% below China’s and real estate at USD 0.50-0.70 per sq ft monthly in industrial parks.
These differences make Mexico ideal for mid-volume, customized production, while China suits mass-market goods. In 2025, nearshoring savings in Mexico can reach 20-30% on total ownership costs for US firms.
Labor and Operational Costs
Labor in Mexico averages USD 4.20 hourly base, with fringes adding 50-70%, totaling under USD 7 burdened. China’s equivalent is USD 6.50 base, burdened to USD 8-10, impacted by social insurance hikes.
Operational costs in Mexico benefit from IMMEX duty deferrals, saving 16% VAT on imports, versus China’s export rebates but higher raw material tariffs amid US-China disputes.
Hidden Costs and Savings
Hidden costs in China include longer lead times (4-6 weeks shipping) versus Mexico’s 1-2 days trucking to the US, reducing inventory holding by 40%. Mexico’s stable peso mitigates currency risks better than China’s yuan fluctuations.
Savings in Mexico extend to utilities at 20% less and faster setup via shelter programs, offsetting China’s volume discounts.
Logistics and Supply Chain Advantages
Manufacturing in mexico vs china highlights logistics as a key differentiator, with Mexico’s proximity enabling just-in-time delivery to North America, cutting transit times from weeks to days and logistics costs by 25-50%. China’s global reach suits Asia-Pacific markets, but faces ocean freight delays and higher fees amid Red Sea disruptions in 2025.
Supply chains in Mexico integrate seamlessly with US suppliers under USMCA, requiring 75% regional content to avoid tariffs, while China’s chains grapple with 25% US tariffs on many goods. This shifts favor to Mexico for resilient, shorter chains.
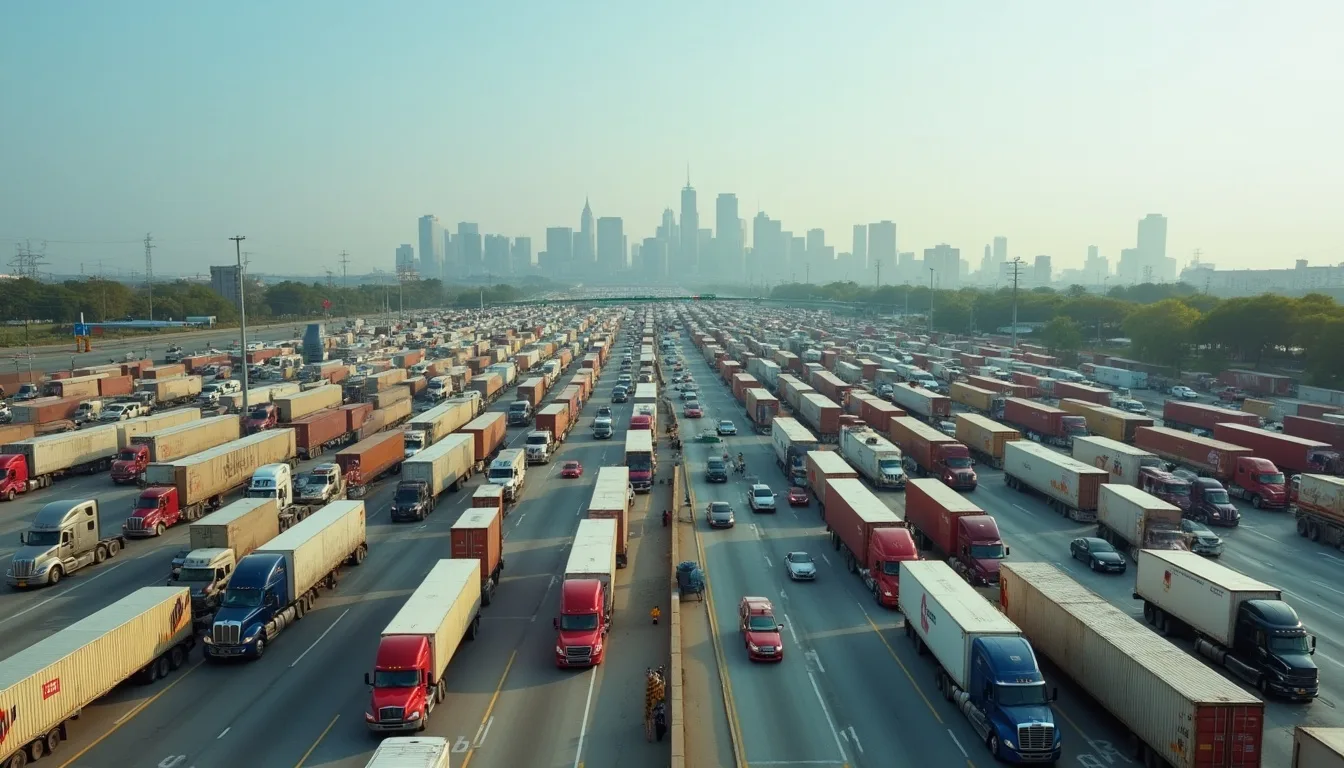
In 2025, Mexico’s infrastructure investments, like expanded ports, enhance efficiency, contrasting China’s port congestions.
Shipping and Transit Times
Shipping from Mexico to the US takes 1-3 days by truck, versus 20-40 days by sea from China, reducing capital tied in inventory. Costs average USD 0.05-0.10 per kg from Mexico, compared to USD 0.20-0.50 from China.
This advantage supports agile responses to demand, crucial in volatile markets like electronics.
Supply Chain Resilience
Mexico’s chains show greater resilience post-pandemic, with diversified suppliers and fewer geopolitical risks than China’s US tensions. Nearshoring to Mexico minimizes disruptions, as seen in 2025’s stable auto parts flow.
China’s vast ecosystem offers redundancy but faces export controls on tech, pushing firms toward Mexico for compliance.
Quality and Regulatory Standards Comparison
Quality in manufacturing in mexico vs china is comparable in high-end sectors, with both adhering to ISO standards, but Mexico excels in FDA and US regulatory alignment for medical devices and food. China’s quality varies, with improvements in tech but ongoing concerns in counterfeits.
Regulations in Mexico harmonize with USMCA, easing exports without additional tariffs, while China’s compliance with US rules incurs extra scrutiny and costs. In 2025, Mexico’s 700+ FDA-registered facilities underscore its edge in regulated industries.
Both nations invest in quality control, but Mexico’s proximity allows real-time audits, enhancing trust.
Quality Control Practices
Mexico employs Six Sigma and lean methods in clusters like Tijuana, achieving defect rates under 1%. China’s mass production uses automation for consistency but faces variability in smaller suppliers.
Training programs in Mexico, with 120,000 engineers graduating yearly, bolster quality, matching China’s vast talent pool.
Regulatory Compliance and Certifications
Mexico’s COFEPRIS aligns with FDA, facilitating 510(k) approvals faster than China’s NMPA processes. This benefits pharma and medtech exports.
China leads in CE marking for Europe, but US tariffs hinder. Mexico’s USMCA perks ensure smoother market access.
Workforce and Skills in Manufacturing in China vs Mexico
Manufacturing in china vs mexico contrasts workforce scales, with China’s 100 million+ industrial workers offering vast capacity versus Mexico’s 9 million focused on skilled roles. Mexico’s younger demographic (median age 29) provides long-term stability, while China’s aging population raises costs.
Skills in Mexico emphasize bilingual engineers and technicians, ideal for US collaboration, with wages 20% lower productivity-adjusted. China’s workforce excels in high-volume efficiency, but faces rising turnover.
In 2025, Mexico’s vocational programs address gaps, enhancing appeal for nearshoring.
Labor Availability and Skills
Mexico’s labor pool grows with 1 million annual entrants, trained in STEM via partnerships like Siemens. China’s massive force suits mega-projects, but struggles with skill mismatches in advanced tech.
Availability in Mexico’s border regions ensures low absenteeism, contrasting China’s urban migration issues.
Turnover and Training
Turnover in Mexico averages 15-20%, managed through benefits, versus China’s 20-30% in coastal areas due to competition. Training investments in Mexico yield quicker ROI given lower base costs.
Emerging Trends and Future Outlook
Trends in manufacturing in mexico vs china show Mexico gaining with nearshoring, attracting USD 31 billion FDI in H1 2025 versus China’s slowdown amid tariffs. EVs and sustainability favor Mexico’s green incentives.
Outlook predicts Mexico’s exports growing 5-7% annually through 2030, closing gaps with China’s scale via tech adoption. Geopolitics may accelerate shifts.
Businesses weigh China’s volume against Mexico’s agility for strategic fits.
Here’s a comparison table for manufacturing in mexico vs china (2025 data):
| Aspect | Mexico | China |
| Labor Cost (Burdened, USD/hr) | 6-7 | 8-10 |
| Shipping Time to US | 1-3 days | 20-40 days |
| FDI Inflow (H1 2025, USD B) | 31 | Declining |
| Workforce Size (Manufacturing) | 9M | 100M+ |
| Tariff Risks to US | Low (USMCA) | High (25%) |